What is the Organisational Factors Page?
The Organisational Factors page breaks down the score into 24 variables, showing detailed drivers of employee experience with comparison options and ranking views.
Organisational Factors Page
This page breaks the organisational factor score into its 24 underlying variables. As with all scores, these variables are shown for all comparison groups and allow for detailed analysis of the drivers of employee experience.
Each display widget includes buttons allowing individual comparison markers to be displayed or hidden on the chart. There is also a download to PNG button and a show all content toggle. This displays the exact score for each comparison group in the legend.
Organisational Variables: All Factors Widget
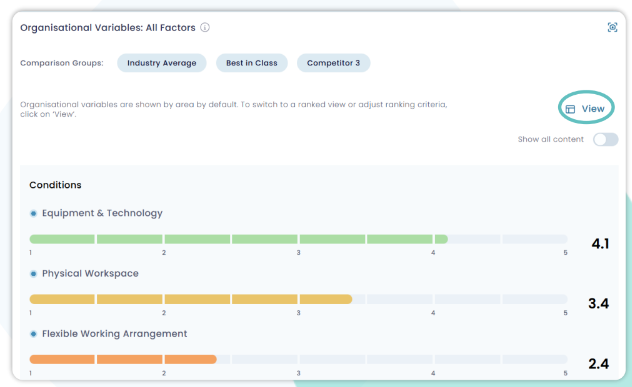
This widget shows scores for all 24 external factors. It provides a comprehensive overview
of organisational variables which influence employees’ work experience and productivity. By default, the widget shows factors grouped By Area. Switching to the Ranked View lets you
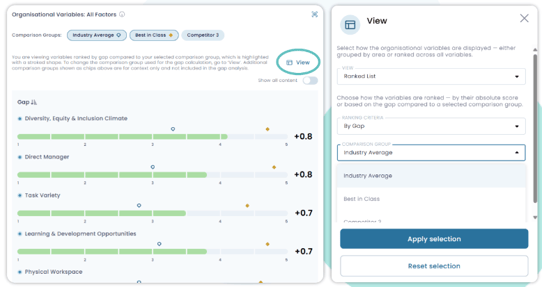
see all factors compared to each other. Factors can be ranked by absolute score or by the gap to a selected comparison group (e.g., Industry Average).

How to Use
Click ‘View’ to customise what you see in this widget. Choose between By Area view
or a Ranked List. For the latter, choose to rank by absolute score or by gap to a
comparison group (which will be highlighted with a stroked shape).
When dataset comparison is applied, you can select the dataset on which you want
to base the ranking by clicking on the icon next to its name. The same icon button can be used to change the ranking order.

